Approaches to more productive meetings include highlighting world events, more detailed program updates and updating dashboards.
After a recent quarterly risk meeting, a senior leader gave this advice to one FX risk manager to improve the productivity of future meetings: Highlight only new developments and events, come with any specific asks and leave anything else to pre-meeting reading materials.
- Up to this point, much of the two-hour meetings consisted of a comprehensive update on everything the FX team had done in the previous month, including reviewing many specific hedges. That often left little time to propose any new initiatives or changes in strategy that would need to be approved by leadership.
- But drastically cutting down the bulk of the meeting, the member said, presented a dilemma, one that resonated with other members at a summit for NeuGroup for Foreign Exchange sponsored and co-hosted by Chatham Financial: “What else can we talk about?”
What’s new? Sometimes, the member said, pressing current events or updates on new hedging programs help to fill the entire time—but you can’t always count on that. Breaking down the impact of Covid, supply chain disruption and the crisis in Eastern Europe has occupied most of the time in recent risk meetings, “but you don’t always have a black swan event to respond to,” the member said.
- Some members responded that the best use of this time is to dig deeper into currency updates and analyze the performance of hedging programs. Not content with only understanding the sources of unexpected FX gains or losses, also known as “noise,” one member shared that he takes an extra step, documenting causes of noise using reason codes.
- “We delve into the results in the key drivers, which requires being prepared for and understanding sources of noise,” he said. “Then, we can share if we are over-hedged or under-hedged, which the board appreciates.”
- Since many members said that their teams only track hedging performance through Excel, preparing analysis and charts to visualize it can be very time-consuming. “We perform reconciliation and noise allocation, then identify high-risk currencies and prepare decks before we meet,” he said. “It can be a challenge to perform as much work as we can ahead of time.”
Dig into currencies. To address the challenge, one member set up automated dashboards for each currency in Power BI, which he said has been very beneficial in meetings with leadership, and essentially eliminates any prep time for reports by currency.
- “Like many others, our FX risk management policy focuses on reducing volatility,” he said. “What is very important is that we do active, monthly monitoring looking at FX results.”
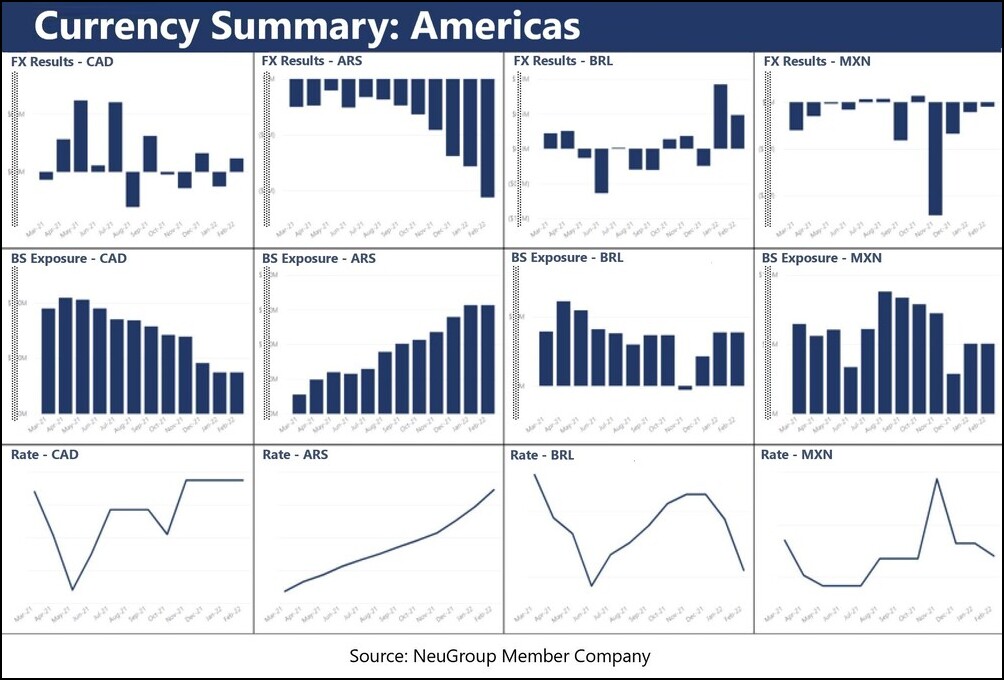
- Power BI pulls FX data from the company’s TMS and ERPs covering gains and losses on monitored currencies, their related balance sheet exposures and the company’s published monthly FX rates for each currency, as shown in the charts below.
- “We have a dashboard in Power BI that key people have access to, and then we have a pack of dashboards that export so we can present at board meetings, but also can be a historical record,” he said.
- For now, more detailed analysis of hedging performance is still done in Excel, but the member said he is working to improve this process in a similar fashion.
Making use of extra time. If there is still time remaining after in-depth results and currency updates, one member said he comes prepared to present on concerns that may not yet be on leadership’s radar.
- “If there is something we’re seeing as an issue in treasury, leadership may not have as nuanced of a view of it as we do, and we want our voice to be heard when they are talking with a distributor,” he said.
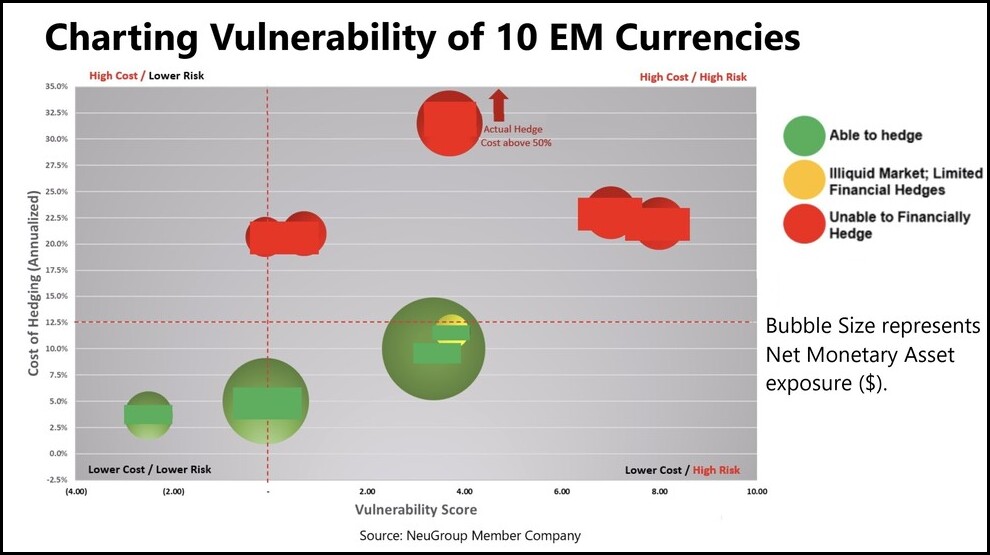
- The member recently started using a vulnerability chart of the 10 top EM currencies that the company has exposure to, and plots each currency based on its vulnerability and cost to hedge. In the chart below, currencies (unidentified) are plotted by vulnerability, cost to hedge and exposure. The dotted red lines show how the company can set limits on when hedging becomes too expensive, or when a currency becomes too vulnerable.
- “We’re trying to drive conversation with the business and be seen as a vital partner,” he said.